Quantcast
Channel: Yogesh Khatri's forensic blog
Viewing all 61 articles
Browse latest View live

Amcache.hve in Windows 8 - Goldmine for malware hunters

$
0
0
Corey Harell has uploaded an excellent writeup on the working of Windows Application Experience and Compatibility features. Here he explains how process entries/traces show up in locations such as the ShimCache and RecentFileCache.bcf. For forensic/malware analysts, this is a great place to search for recent processes that were run.

This post is a logical continuation of Corey's post. In Windows 8, the 'RecentFileCache.bcf' file has been replaced by a registry hive named 'Amcache.hve'. The location of this file is the same as its predecessor:
<DRIVE>\Windows\AppCompat\Programs\Amcache.hve

This file stores information about recently run applications/programs. Some of the information found here includes Executable full path, File timestamps (Last Modified & Created), File SHA1 hash, PE Linker Timestamp, some PE header data and File Version information (from Resource section) such as FileVersion, ProductName, CompanyName and Description.

The Hive

Amcache is a small hive. Below is a view of the hive loaded in encase. There are only 4 keys under a 'Root' key. (Folders in the registry are called keys). The data of interest to us is located in the 'File' key. Files are grouped by their volume GUIDs. These are the same Volume GUIDs that you can find in the SYSTEM hive under MountedDevices and also under NTUSER.DAT MountPoints2.

File References

Under each volume guid are File Reference keys each representing a single unique file. In case of an NTFS volume, this key name will look something like this: e0000430d. This is the NTFS File Id and sequence number. Here sequence number is 0eand file id is 0000430d. For FAT volumes it is unknown what this value represents.

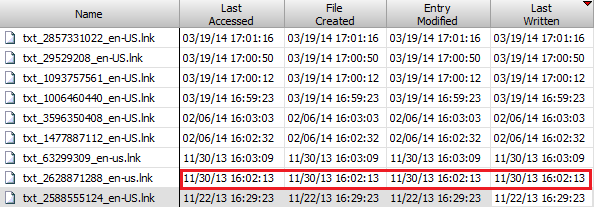
The Last Modified date on this key may be taken as the first time a particular application was run. I have not seen it change on subsequent runs. Under this key reside several values holding details about that file. Refer the illustration below. This is for a file on a FAT volume on external USB disk.


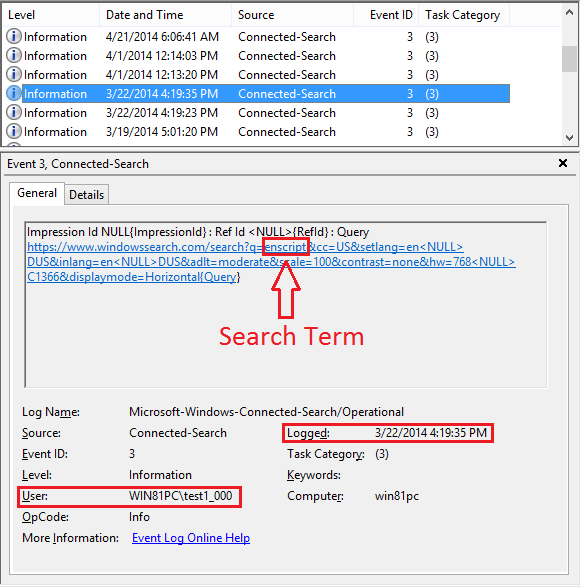
Value Names are in hexadecimal and range from 0 to 17 and then two extra entries for 100 and 101 are seen. Here are the descriptions I have been able to decipher so far.

ValueDescriptionData Type
0Product NameUNICODE string
1Company NameUNICODE string
2File version number onlyUNICODE string
3Language code (1033 for en-US)DWORD
4SwitchBackContextQWORD
5File VersionUNICODE string
6File Size (in bytes)DWORD
7PE Header field - SizeOfImageDWORD
8Hash of PE Header (unknown algorithm)UNICODE string
9PE Header field - ChecksumDWORD
aUnknownQWORD
bUnknownQWORD
cFile DescriptionUNICODE string
dUnknown, maybe Major & Minor OS versionDWORD
fLinker (Compile time) TimestampDWORD - Unix time
10UnknownDWORD
11Last Modified TimestampFILETIME
12Created TimestampFILETIME
15Full path to fileUNICODE string
16UnknownDWORD
17Last Modified Timestamp 2FILETIME
100Program IDUNICODE string
101SHA1 hash of fileUNICODE string

I've written an Enscript to parse out this information to the console. Download here. This is code, not an enpack, so anyone can easily translate to python or perl or another open platform.
It outputs Amcache information as shown below:

File Reference = 03f180
Volume GUID = {8e49b4d2-4d4a-11e3-9717-000c29775430}
First Run Timestamp (Last Modified on key) = 11/15/13 19:48:19
Modified Time 2 = 11/03/13 17:42:39
File path = E:\Fetch.exe
Language Code = 0
PE Header Hash = 01012bb2314b06e59d290d4effbab22e77d7f87ecbeb
File Size = 58880
PE Header SizeOfImage = 77824
PE Header CheckSum = 0x00014D67
PE Header Linker Timestamp = 0x4E8B796E = 10/05/11 02:53:58
Modified Time = 11/03/13 17:42:40
Created  Time = 10/04/11 23:23:58
SHA1 hash = 000005b6d3ebc6a5484a270f4f0e04738d1e5a53ee25

The Unexplained

There are two Last Modified timestamps (11 and 17). I have noticed that the timestamp in 17 is almost always 1 second behind the timestamp for 11. This is a bit of a mystery, it is probably due to conversion to a DOS timestamp and back.

The SHA1 hash is a vital bit of information that MS has added, as now we can track malware even if its deleted/wiped itself from the system. Also, since the hive stores data about volume guids and file references, it can also be added to the list of location to review to aid in tracking of USB devices. 

Amcache.hve - Part 2

$
0
0
My last post about the Amcache.hve file only concentrated on the 'File' key since that's where all of the good stuff is! This post describes the remaining contents of the Amcache.hve file, the other files in the AppCompat folder (where Amcache.hve is located) and useful information contained therein.

As noted in the earlier post, there are 4 sub-Keys containing data - File, Generic, Orphan, Programs. There is also one value called Sync as shown below.

Contents of Amcache.hve/Root

The Sync value holds an 8 byte FILETIME timestamp. I believe this represents the last time this data was synced with the 'AEINV_CURRENT.xml' file also contained in the same folder as amcache.hve. However, not all information is synced. The synced information appears to be mostly about installed programs or installers run. Traces for standalone application (applications that are not installed) runs are never synced and only remain in the Amcache.hve file.

Programs Key

The 'Programs' key contains data about installed programs, the same information you can find in the Control Panel -> Programs & Features. This is somewhat similar to the data in the File key. Each subkey contains a ProgramID, which is an ID assigned to every MSI (installer) package when it is compiled. Each of these contain values as seen below. The interpretation of these values differ from the ones found under 'File'.


Here is the description for values that exist under Programs.

ValueDescriptionData Type
0Program NameUNICODE string
1Program VersionUNICODE string
2PublisherUNICODE string
3Language code (1033 for en-US)UNICODE string
4~ Not seen ~
5Unknown Flags (usually 256)DWORD
6Entry Type (usually AddRemoveProgram)UNICODE string
7Registry Uninstall KeyUNICODE string
8~ Not seen ~
9~ Not seen ~
aInstall DateQWORD (Lower 4 bytes is unix date)
bUnknown (always zero?)QWORD
c~ Not seen ~
dList of File PathsUNICODE strings (REG_MULTI_SZ)
fProduct Code (GUID)UNICODE string
10Package Code (GUID)UNICODE string
11MSI Product Code (GUID)UNICODE string
12MSI Package Code (GUID)UNICODE string
13Unknown (usually zero)QWORD
FilesList of  Files in this package (VolumeGuid@FileRefUNICODE strings (REG_MULTI_SZ)

In my analysis, most of the files (not all) referenced in the 'Files' list here could be found in the 'File' key.

Orphan and Generic Keys

The Orphan Key contains keys having the name in the format VolumeGuid@FileRef. A sample key looks like this:
      Orphan\44177282-4260-11e3-9713-806e6f6e6963@30000e61a
where '44177282-4260-11e3-9713-806e6f6e6963' is the Volume GUID and '30000e61a' is the file reference number. Beneath this key is a single Value by name 'c' containing an unknown DWORD value which is either 0 or 1.

'Orphan' key in Amcache.hve Hive
See the below screenshot for a view of the Generic Key. Under the '0' subkey you find many keys which are either GUIDs or File IDs. These File IDs (as Microsoft calls them) are simply SHA1 hashes of the files they represent.  It is unknown what the GUIDs represent. Similar to the Orphan keys, here too each of these leaf node keys (GUID or File ID) has a value by name '0' containing an unknown DWORD which is either 0 or 1.
'Generic' key in Amcache.hve Hive
Cross referencing entries from the 'File' and 'Programs' keys to the files referenced by Generic and Orphan shows many matches, many missing as well as extra entries. So the relationship between these is not entirely clear.

Other files in this folder

Apart from the log/cache files associated with the Amcache.hve hive, there are some other files in the AppCompat folder:
  1. AEINV_AMI_WER_{MachineID-GUID}_DATE_TIME.xml
  2. AEINV_CURRENT.xml
  3. AEINV_PREVIOUS.xml
The AEINV here stands for 'Application Experience Inventory'.
All of the above are XML files containing similar data about installed programs, files, application metadata and IE Addons (toolbars and plugins) information. The AEINV_AMI_WER_{MachineID-GUID}_DATE_TIME.xml file is related to Windows Error Reporting (WER). Here the MachineID-Guid is a value generated and used by WER only. This file existed in Windows 7 too with almost the same contents.

Device Information (new in Windows 8)

In Windows 8, this file also stores machine Device information containing among other things USBSTOR information although not in the detail found elsewhere in the registry. So you don't have device unique serial IDs or container IDs but you do get some descriptive strings like 'Seagate Backup+' or 'Sandisk Cruzer v3'. It does contain some Device GUIDs (although I am unable to match it to anything in the registry or setupapi log yet).

Snippet from AIENV_AMI_WER_xxxxxx xml file showing USBSTOR device info

AEINV_PREVIOUS.xml also existed in same format in Windows 7. AEINV_CURRENT.xml is a new addition in Windows 8, but contains similar data. By analyzing the timestamps and USNJRNL log, it is apparent that periodically the 'PREVIOUS' file gets deleted, then the 'CURRENT' file get renamed to 'PREVIOUS' and a new 'CURRENT' file is created and populated with data. (That was obvious from the file names but I just had to confirm!)

Snippet from the parsed NTFS $USNJRNL.$J file

Device LastRemovalDate & LastArrivalDate Behavior in Windows 8

$
0
0
Many people have asked me the conditions when the LastRemovalDate property gets populated and why its missing in some cases. I had run some test cases to determine the conditions and behavior of windows 8 with device insertions and removals earlier and am now documenting the results here. For those unaware of these timestamps, please read the post here first.

Device activity behavior

Whenever a device is plugged into a windows 8 machine, the LastArrivalDate timestamp gets set (to current date & time). At the same time, the LastRemovalDate gets deleted (if it was set earlier). Now whenever the device is removed from the system (when system is running!) that is the only time the LastRemovalDate will get set (to current date & time). Windows can detect both a clean eject as well as an unclean direct disconnect of the device, and in both cases the LastRemovalDate timestamp gets set.

If a device is attached to a system and then the system is shutdown subsequently with device still attached, then the LastRemovalDate will NOT get updated! So if you are seeing a missing value for LastRemovalDate, this is likely what happened, ie, the device was still plugged into the system when it was shut down. So the windows last shutdown timestamp for that session could be taken as the LastRemovalDate by an analyst.
Now on subsequent reboot(s), this device timestamp (LastRemovalDate) will not get updated and it will remain missing, until the device is seen by windows again and windows witnesses a removal of that device (as noted above).

However, also note that even if the device is NOT removed and re-plugged in, windows will still treat it that way when you reboot the system. So, reboots with a USB disk plugged in will update the LastArrivalDate as if it had been inserted immediately on boot.  This means that if you have a USB disk always connected to the system and never removed, windows will still update the LastArrivalDate each time on a reboot.

How this impacts an analysis?

The forensic analyst must be careful about interpretation here, the LastArrivalDate may not be the last time the device was physically connected by a user, it may have been there (connected) for a long time prior! One way to check is compare this with the system boot time. If they are quite close (within a few seconds or a minute), then its probably connected prior to boot, else it was indeed the last time device was physically connected.

Also because LastRemovalDate is deleted upon subsequent device arrivals, you should never ever see LastRemovalDate that is prior to a LastArrivalDate. If you do, then that probably means the clock on the machine has been altered between insertion and removal of the device!

The table below summarizes activity and behavior of these timestamps.

Activity / Action
LastArrivalDate
LastRemovalDate
Device Plugged in
SET
DELETED
Device Removed
 (Both Clean Eject & Direct Removal)
-
SET
Machine Shutdown with device still plugged in
-
-
Machine Restarted with device still plugged in (device not removed and re-attached)
SET
DELETED
    The dash ( - ) indicates no changes occured, values remain what they were earlier.

Search history on Windows 8 and 8.1

$
0
0
Windows 8 introduced a new feature of saving previously searched terms/keywords. I am refering to the Windows Search functionality which moved from the Start-menu in Windows 7 to the Charms bar in Windows 8.

Search terms are saved on a per user basis. In Windows 8, this is stored as an MRU (Most Recently Used) list in the NTUSER.dat file under the key:
Software\Microsoft\Windows\CurrentVersion\Explorer\SearchHistory\Microsoft.Windows.FileSearchApp

Figure 1 - Search history (MRU) in Windows 8 registry

Windows 8.1

On Windows 8.1 this has changed! These entries are no longer stored in the registry, instead they are stored on disk at:
\Users\<USER>\AppData\Local\Microsoft\Windows\ConnectedSearch\History

They are stored as individual link (LNK) files. Each link file holds a single previously searched for keyword (or phrase).

Figure 2 - Search history in Windows 8.1 stored as LNK files

The format of this link file is similar to the one we are familiar with from earlier versions of windows, however, no dates or other details typically seen in link files are included. All it contains is a link header and a shell item id list. The shell item id list contains the keyword/phrase searched for. Current link file parser scripts/tools will not be able to parse this correctly as they are either not parsing the Shell item id list or not (yet) looking for this specific information. (A shell item id list is seen in many places in the registry, one of the more popular artifacts that uses it is the 'shell bags').

Figure 3 - Search history LNK file showing searched term 'enscript'
As seen in figure 3 above, this link file has the same header as well as basic format. The link guid at offset 0x4 is also the same. Link flags (0x80) indicate only a Shell Item Id List will be present and all other fields are blank (zero). The shell item id list contains a single property identified by guid '{F29F85E0-4FF9-1068-AB91-08002B27B3D9}'. This guid identifies the Microsoft Office Summary Information Properties. Only a single value is populated and that is the keyword/phrase searched for.

Forensic Importance

From a forensic perspective, this ties a search keyword to a user and a date. This means that we now know the date and time when a particular user searched for a specific keyword on the machine. The last modified timestamp gives us the first time that keyword is searched and it does not get updated after, even if the search is repeated. On my machines, all 4 timestamps (created, accessed, modified, entry modified) hold the same value for a single file (see figure 2 above) and don't seem to get updated/altered once created.

Windows 8 Thumbs.db files - still the same and not the same!

$
0
0
Screenshot of folder in Windows 8 showing Thumbs.db

Thumbs.db files have made a comeback in windows 8. Now, like in windows XP, explorer will create these files in every folder containing media files. This used to be a great forensic resource for investigators because thumbnails once created and stored in the Thumbs.db remained there even after the image file itself was deleted. This behavior is also noted with Windows 8.

The only thing that is different is the format of these new Thumbs.db files. It is not the Windows XP format and the usual thumbs.db file viewers including most forensic tools will not parse this file correctly. The format is actually the same as Windows 7 Thumbs.db files. Yes, that was not a typo, I said 'Windows 7'. I had looked into this earlier and the details are available here.

An interesting thing to note is that in windows 8, the same Thumbcache_*.db files are still maintained on a per user basis like windows 7 does. So the Thumbs.db is really a redundant location for these thumbnails as they are already cached in the Thumbcache database. So why the duplication?

Update (Thanks proneer for this tip!):
There are some caveats here. On windows 8, Thumbs.db will only be created in folders under a user profile folder, so anything created in C:\ or C:\program files or C:\program data or any other folder not under a user profile, ie, C:\Users\<USER>\* will not have thumbs.db files. 

But this has got nothing to do with a particular logged in user. A thumbs.db file will be created even when the logged in user browses folders of another user under their profile (as long as file permissions allow that user to write files to the other users' folder).

This behavior is different from Windows 7 thumbs.db where the location does not matter for creation of thumbs.db files.

There is another oddity noted. Sometimes a thumbs.db is created immediately upon folder being opened in explorer, on other occasions it has be triggered by changing the 'view' of the folder to 'Large icons'.

Search history on windows 8.1 - Part 2

$
0
0
I have recently blogged about windows 8.1 search history and how searched terms/phrases are recorded as LNK files in a post here. But windows also logs searched terms (search history) to the event log and web history (and cache).

From the LNK files, we know the first time a term was searched for, but not the next time or the last time it was searched, which is usually more relevant from an investigation perspective. However, this information can be obtained from the Connected-Search event log file. On disk it would be under:
 \Windows\System32\Winevt\Logs\Microsoft-Windows-Connected-Search%4Operational.evtx

Under Event viewer, you can find it under:
 \Applications and Services Logs\Microsoft\Windows\Connected-Search\Operational

Below is a screenshot for one such log entry.

Searched keyword is 'enscript' and machine was online when search was run

Windows logs all URLs and reference links here. Windows, by default tries to search for everything online as well as on the machine. Even if you are offline, a search URL for online searches is generated and seen here. The screenshot below shows the same search run when machine was offline (not connected to internet).

Searching for 'enscript' when machine is offline

Each time a search is run, an entry is created, sometimes multiple entries (this probably has to do with different views when browsing the search results). For searches (if machine was online), the URL requests and responses are also found in the IE web history and cache database (WebcacheV01.dat). The database is located at
\Users\<USER>\AppData\Local\Microsoft\Windows\WebCache\

The best way to study this data would be by parsing this database either manually (using libesedb and lots of data formatting with additional parsing!) or use a free program like IE10 History reader (or an expensive brand forensic tool). However, if you are just interested in the search terms without dates or other information, a raw search into the datebase files will suffice.

To find searched terms, you will need to search  for URLs beginning with
 https://www.windowssearch.com/search?q=

The screenshot below shows hits when searching the IE web cache files for the above URL using Encase.
Search hits in IE web cache database as seen in encase

Search as you type

An aspect missing from LNK files and the event logs is the search suggestions and interim search results. As Rob Lee hinted to me earlier that a user could search for a term (without hitting Enter or the search button after entering the term in the search box), but not click on any results and none of the above artifacts would be created. Windows uses the 'search as you type' feature and  terms windows guessed for you (as you were typing into the search box) or interim search results are discarded. However you would find some traces of the terms as windows will make online queries for the 'search as you type' feature. If this is not clear, just recall how you search with google. As you begin typing the letters of your keyword into the search box, google automatically suggests most popular searches beginning with those letters. Windows also does the same thing.

Google's search as you type feature

To find such searches which were discarded, search for URLs beginning with
  https://www.windowssearch.com/suggestions?q=

Actually, these are not the suggestions, but the lookups for term/phrase entered into the search box. The data returned (query response) will contain the suggestions.

Below is a screenshot showing the webcacheV01.dat file (and supporting db files) with search hits as displayed in Encase.

Search hits showing Windows querying for popular search term suggestions based on user entered input

Thus there are multiple locations (connected search LNK files, event logs, web cache) where an investigator can find evidence of searches run by a user. Each has its uses and caveats.


Amcache on Windows 7

$
0
0
The amcache registry hive which made its debut in windows 8, is now also showing up on Windows 7 systems. I was alerted to this by a fellow DFIR analyst Clint Hastings, who noticed this and has been using my scripts to parse them on windows 7 for some time now.

Amcache on Windows 7


So, what happened? After a bit of investigation on my machines, it was traced to Windows Update KB2952664, which updates the application inventory and telemetry (Microsoft terminology for the programs that monitor application usage) executables and libraries.

The update first came out in April 2015, but it appears as if it was not widely deployed (automatically) until around October.

Both Amcache.hve and RecentFileCache.bcf are updated now. I verified this information by parsing both these artifacts. Amcache of-course, had a lot more detail about the same files. So, don't forget to look for amcache on your windows 7 examinations.

Parsing the Windows 10 Notification database

$
0
0
Notifications on windows was a new feature added with windows 8 and continues in 10. In this post, I briefly discuss the format and data obtained from these notifications. Notifications can hold useful recent data (and some not so recent data) such as popup messages from applications, email snippets, application specific data like torrent downloaded messages among other information. As of now, not many applications use this feature on windows (when contrasted to apps on mac), but that is changing as more applications begin adding support for sending events to the Notifications Center/Bar.

As pointed out by Brent Muir here, this database is located at:
\Users\<user>\AppData\Local\Microsoft\Windows\Notifications\appdb.dat

This Notifications database holds not just the popup notifications which the user sees briefly, but also  any updates to Tiles on the new windows start screen/start menu. Under the notifications scheme used by windows, there are 4 types of notifications, Toasts (popups), Tiles (updates on app live tiles like latest news stories, tweets or weather), Badges (small overlay on tile used to show status or count of items) or Raw push notifications (app specific data).

Appdb.db is a binary database having the signature 'DNPW' as the first 4 bytes. The structure of the file is roughly as shown below:

By default, there are 256 chunks in the file. Each chunk has a header element, however, only the first chunk has the header filled in. The chunk header starts with the DNPW signature, followed by what I believe to be the time the last notification was displayed to the user (8 bytes FILETIME) and the next sequential Notification ID to be used, and some unknown data after that (12 bytes).

The header is followed by data that I assume to be flags (8 bytes), followed then by Push URI (URL used by apps to push data and notifications to the client), Badge XML content and Tile Data (5 metadata objects and 5 corresponding XML data strings). Each of these elements in the chunk has its own data structure, which is quite detailed in itself. I am not reproducing all the structures here. To get this information, download the 010 Template (from link below) containing all the definitions for structures (deciphered so far..). There is also a python script available to parse information from this file and write out to a CSV file.


WofCompressed streams in Windows 10

$
0
0
On windows 10, there is a new 'System Compression' option that compresses files using reparse points. This is not the NTFS-based compression that earlier versions of windows utilized, its different. This post is about the new compression scheme and how it affects forensic analysts.

With windows 10, a lot of details are automatically managed without user input and this is one of them. Windows can determine if the compression will be beneficial to the host system and automatically trigger it! This usually happens when you upgrade as opposed to clean installing the OS. Some users have reported seeing it as an option in 'Disk Cleanup' too.

Windows provides a utility called Compact.exe to do this processing manually. Using it, you can compress/decompress files and folders or simply query a system to determine if it will be beneficial at all on a specific volume. The compression algorithms are XPRESS (4K, 8K, 16K) or LZX. While the files are compressed on disk, if an application opens/reads such a file, it is still getting the original decompressed data and all decompression is handled on the fly automatically by windows 10.

Figure 1 - Compact.exe and its command usage info
The command 'compact /exe <file>' will compress any file (not just exe)

Lets get to the point, how does this impact forensics

Well, as of now, no tools will recognize and decompress these files. Hence, you can't read, keyword search or extract these files in their original uncompressed form.


Tools tested

Here is a list of tools tested so far:

Tool VersionSupport (as of 10/26/2016)
SIFT Workstation3No
Autopsy4.2.0No
FTK6.0.1.30No
Xways Forensic19.0No
Encase8.01No


How it works?

System compression utilizes reparse points and creates a new Alternate Data Stream (ADS) having the name 'WofCompressedData'. The compressed data is stored here. Reparse points are an NTFS feature that allow custom implementation like this. However this means that other applications that are not aware of this custom implementation will not be able to read/write to that file. In encase (or other forensic tools), you can see the file and the WofCompressedData stream. Clicking on the file just shows the contents to be all zeroes. Clicking on the stream, you can get the compressed data, but as of now, no automatic transparent decompression (as it does with NTFS compressed files). This is seen in screenshot below.

Note - This isn't to be confused with WOFF compression, which is a compression scheme used in Web Open Font Format!

Figure 2 - Encase shows the WofCompressedData stream. The file's original data was all text.
If you mount a volume containing such compressed files in SIFT Workstation or any linux system (they all use the same NTFS-3g FUSE driver), you will see the message 'Unsupported reparse point' when trying to list these files. Trying to access file contents will result in errors as seen in screenshot below.

Figure 3 - Files DW20.exe and upgrader_default.log are compressed here
If you attach a windows 10 formatted volume/disk to a Windows 7 system, you won't be able to access files as it does not know how to read them. See screenshot below:

Figure 3 - Notepad trying to view upgrader_default.log file (which is compressed)

Workarounds (till supported is added in by tool developers)

For Linux

If you use SIFT or another Linux system to do your forensics, the fix is simple. A few months back, Eric Biggers wrote a plugin to handle this. Its a plugin to the ntfs-3g FUSE driver. Its available here:
https://github.com/ebiggers/ntfs-3g-system-compression

For this, you will first need to download, compile and install the latest version of the ntfs-3g driver (but not from Tuxera, that one is missing a file!); then proceed to download, compile and install the above mentioned plugin. You can get this working on SIFT with roughly the following steps:

1. Go to https://launchpad.net/ubuntu/+source/ntfs-3g and download the source code for the latest stable release, right now its ntfs-3g_2016.2.22AR.1.orig.tar.gz.
2. Unzip and extract the file downloaded.
3. Open Terminal and browse to the extracted folder.
4. Compile and install using commands:
./configure
make
sudo make install
4. Go to https://github.com/ebiggers/ntfs-3g-system-compression and download the entire code as a zip file.
5. Unzip and extract the archive.
6. Open Terminal and browse to the extracted folder.
7. A few more tools need to be installed to compile this, so run the following commands:
sudo apt-get update
sudo apt-get install autoconf automake libtool
8. Run following commands to generate a configure script:
mkdir m4
autoreconf -i
9. Compile and install
./configure
make
sudo make install
10. If all went well (without errors), you are done!

Now you should be able to view and read those files normally, all decompression is handled on the fly automatically!

Figure 4 - No errors seen listing or reading files after installing the system compression plugin

For Windows

If you use Windows as your host machine for forensics processing, then you should only use a Windows 10 machine for processing evidence files that contain windows 10 images. This applies to tasks such as antivirus scanning, where you would typically share the entire disk out using Disk emulation (if you use Encase) which allow windows to parse and interpret the disk. This would only work (to read system compressed files) if the host system is Windows 10.

If you are looking to identify the system compressed files, you could filter on all files with ADS streams that have the name 'WofCompressedData'.

Fortunately, by default windows only compresses system files (EXE/DLL in windows and system32) and not user files, so you should mostly be fine. However, users can compress any file manually using the compact command.

Flexing SQL muscle for parsing an MS db on OSX

$
0
0
This post is about using recursive SQL queries (or rather a single recursive query) to parse the MicrosoftRegistrationDB.reg file created by Microsoft office on Mac OSX systems.

A little background..

On OSX (mac), there is no registry. Most apps just use plist files instead to save local information. Microsoft Office leaves cache and configuration information in plist files like every other OSX application. However it also keeps a copy in this file – microsoftRegistrationDB.reg. The file can be found here –

/Users/research/Library/Group Containers/xxxxxxxxxx.Office/MicrosoftRegistrationDB.reg

This is an sqlite database which is a flattened version of the registry tree that office would create in windows under HKCU\Software\Microsoft\Office, the format of which is quite straight-forward and documented. Some useful MRU artifacts and configuration settings reside here.

The sqlite database has the same fields as in the registry, namely - key, key_last_modified_time, value_name, value_type and value_data. This is nicely arranged in the following table structure.

Figure 1 - Database table schema

Pulling the data out is fairly simple in SQL. However, if you wish to recreate _all_ the registry paths from the flattened tree, then it’s a bit more involved. In the HKEY_CURRENT_USER table, each key has a single entry and along with the key name, you have the parent key reference. As an analyst, you would like to get full key path (i.e. HKCU\Software\Microsoft\...) for every value. There lies the problem. To recreate the paths for every single registry value, you would have to run several individual SQL queries, each query would fetch a key’s parent, and you keep doing that till you reach the ROOT of the tree. You could do this in a recursive function in python. Or you can let SQL do the recursion by running a recursive query. Sqlite supports recursive queries. You can read up about recursive queries in sqlite here and here.

The Final Query

SELECT t2.node_id, t2.write_time, path as Key,
  HKEY_CURRENT_USER_values.name as valueName,
  HKEY_CURRENT_USER_values.value as value,
  HKEY_CURRENT_USER_values.type as valueType from
(
  WITH RECURSIVE
    under_software(path,name,node_id,write_time) AS 
    (
      VALUES('Software','',1,0)
      UNION ALL
      SELECT under_software.path || '\' || HKEY_CURRENT_USER.name,
          HKEY_CURRENT_USER.name, HKEY_CURRENT_USER.node_id,
          HKEY_CURRENT_USER.write_time
        FROMHKEY_CURRENT_USERJOIN under_software ON
          HKEY_CURRENT_USER.parent_id=under_software.node_id
        ORDER BY 1
    )
  SELECT name, path, write_time, node_id FROM under_software

as t2 LEFT JOINHKEY_CURRENT_USER_valueson
  HKEY_CURRENT_USER_values.node_id=t2.node_id;

Here the ‘WITH RECURSIVE’ part will perform the recursive querying for every value item. It will create the full key path for that value. The line:
SELECT under_software.path || '\' || HKEY_CURRENT_USER.name’ will concatenate the parent key path with the sub-key name using backslash as separator. The double-pipe ‘||’ is the concatenate operator. The 'ORDER BY 1' is not really necessary, but this makes it sort the output by the first parameter to the recursive function, i.e, path.

A python script to do this automatically is available here. This script will run the recursive query on the database and then provide both a csv and a plist as output. I chose to output as a plist too because this data is best viewed as a tree as shown below.

Figure 2 - Sample plist produced by script (viewed in plist Editor Pro)

The mystery of /var/folders on OSX

$
0
0
The /var/folders (which is actually /private/var/folders) has been a known but undocumented entity for a very long time. Apple does not document why its there, or what it is. But there are plenty of guides online that suggest it may be good to periodically clear those folders to recover disk space and perhaps speed up you system. Whether that is wise is beyond the scope of this blog post.

If you've ever done a MacOS (OSX) forensic examination, you've probably noticed some odd folders here, all two character folder names with long random looking subfolders. Something like /var/folders/_p/vbvyjz297778zzwzhfpsqb2w0000gl/. A level below are 3 folders C, T, 0 and you can then see familiar data files under those. The 3 folders represent Cache (C), Temporary files (T) and User files (0)

On a live system these can be queried using the command 'getconf VARIABLE' where VARIABLE can be DARWIN_USER_CACHE_DIR, DARWIN_USER_TEMP_DIR or DARWIN_USER_DIR.

These are locations where mac stores cache and temporary files from various programs and system utilities. They are further segregated on a per-user basis. So each of those folders (Example: /var/folders/_p/vbvyjz297778zzwzhfpsqb2w0000gl) represents a single user's temporary space. 

Whats in it for forensicators?

From a forensics examination perspective, there is not a lot of artifacts here. However some useful artifacts like Notifications databases and Quicklook thumbnailcache databases are located here. The Launchpad dock database is also here. Sometimes you can find useful tidbits of cache from other apps too.

Figure: /private/var/folders on MacOS 10.12 (Sierra) 


It would be nice to be able to determine which user owned a particular folder when analyzing the artifacts within it. This is actually really easy, as you can just look up the owner uid of the folder. But if you are more interested in how the name gets generated, read on.

Reverse engineering the Algorithm

There is an old forum post here that does not provide the algorithm but hints that its likely generated from uuid and uid. Both of which are available from the user's plist (under /var/db/dslocal/nodes/Default/users/<USER>.plist). From the narration, the character set used in the folder names would be '+-0123456789ABCDEFGHIJKLMNOPQRSTUVWXYZabcdefghijklmnopqrstuvwxyz'. However that's not what is seen on newer macs (10.10 onwards)

After analyzing the folder names on my mac test machines, the data set was narrowed down to 0-9, underscore and all alphabets except vowels (aeiou). A little bit of research confirmed this, when the string '0123456789_bcdfghjklmnpqrstvwxyz' was seen in the libsystem_coreservices.dylib binary. The string is 32 char in size, so you would need 5 bits to represent an index which could point to a specific character in the string. After a bit of experimentation with creating a few user accounts and setting custom UUIDs, it was clear how this worked. The  algorithm takes the 128 bit UUID string as a binary bitstream, appends to it the binary bitstream of the UID (4 byte), then runs a single pass over that data. For each 5 bits it reads, it uses that as an index to get a single char from the charset array and copies that to output. A python implementation that generate these folder names (for both new osx versions and older ones) is provided here.

References:

http://www.magnusviri.com/Mac/what-is-var-folders.html

https://arstechnica.com/civis/viewtopic.php?f=19&t=42677

Finding the Serial number of a Mac from disk image

$
0
0
On a mac (osx/macOS), the serial number is usually not stored on the disk, it is stored in the firmware and available either printed on the backside/underside of your mac/macbook computer or accessible via software on a booted system using 'About My Mac' or System Profiler.

On recent versions of OSX, there are however a few system databases that store this information and make it available for forensic investigators to use (or for verification). These are:
  • consolidated.db
  • cache_encryptedA.db
  • lockCache_encryptedA.db
All the above files are sqlite databases located in the 'root' user's Darwin user cache folder located under /private/var/folders/zz/zyxvpxvq6csfxvn_n00000sm00006d/C/. This location should be the same for all OSX/macOS installations (10.9 & above) because UID and UUID of root is same on all systems and does not change. 
For more information on Darwin folders, see this blog post. 

Screenshot 1 - Table 'TableInfo' inside consolidated.db showing Serial Number

In the above screenshot, the serial number is seen starting with 'VM'. It starts with VM since this was a virtual machine; for real machines, you will see the actual hardware serial number here. I was able to verify this on several macs running osx 10.9 to 10.12. 

In addition, other software might retrieve and store this information too. One such software, is KeyAccess, installed by Sassafras asset management system. KeyAccess leaves behind a binary file /Library/Preferences/KeyAccess/KeyAccess Prefs which also contains the serial number.

Another place where you might find the serial is sysinfo.cache. This is created by Apple Remote Desktop and is found at /var/db/RemoteManagement/caches/sysinfo.cache.

Releasing mac_apt - macOS Artifact Parsing Tool

$
0
0
Over the last several months, I've been developing a tool to process mac full disk images. It's an extendible framework (in python) which has plugins to parse different artifacts on a mac. The idea was to make a tool that an examiner could run as soon as a mac image was obtained to have artifacts parsed out in an automated fashion. And it had to be free and open-source, that ran on windows/linux (or mac) without the requirement of needing a mac to process mac images. 

Here are the specifics:
  • INPUT - E01 or dd image or DMG(not compressed)
  • OUTPUT - Xlsx, Csv, Sqlite
  • Parsed artifacts (files) are also exported for later manual review.
  • lzvn compressed files (quite a few on recent OSX versions including key plist files) are supported too!

As of now, there are plugins to parse network information (ip, dhcp, interfaces), wifi hotspots, basic machine settings (timezone, hostname, HFS info, disk info,..), recent items (file, volume, applications,..) , local & domain user info, notifications, Safari history and Spotlight shortcuts. More are in the works.. Tested on OSX images from 10.9-10.12

The project is currently in alpha status. Let us know of bugs/issues, any feature requests, ..

The project is available on GitHub here.

Motivations behind this project:
- Learn Python
- Learn more about OSX

Interpreting volume info from FXDesktopVolumePositions

$
0
0
On a mac, if you wanted to get a list of all connected volumes, you would typically lookup FXDesktopVolumePositions under the com.apple.finder.plist file (for each user). This is available under /Users/<USER>/Library/Preferences/ The volumes listed here can include anything mounted, a CD, a DMG file, a volume from external disk, network mapped volume or anything else that mac sees as a mounted volume/device.

Figure 1: Snippet of 'FKDesktopVolumePositions' from com.apple.finder.plist

The above snippet shows every volume connected to one of our test machines. What's strange is the way the volume information is stored. Ignoring the icon position data (which resides a level below not shown in that screenshot), all that's available is a string that looks like this:


HandBrake-0.10.2-MacOSX.6_GUI_x86_64_0x1.b2a122dp+28

Studying this a bit, it appears that the random looking hex number after the name is not really random. It represents the 'Created date' of the volume's root folder (for most but not all the entries!). The date format is Mac Absolute Time (ie, number of seconds since 2001).
The picture below shows the breakup.


Figure 2: Interpreting volume info from FXDesktopVolumePositions entry


The first part of the entry (till the last underscore) is the name as it appears in the Finder window. The next part ignoring the period is the created date. This is followed by p+ and then a decimal number (usually 0, 26, 27, 28 or 29). I believe that number represents a volume type. From what I can see in some limited testing, if volume type=28, then the hex number is always the created date.

Large external disks (USB) that identify as fixed disks and most DMG volumes will show up as type 28. All USB removable disks show up under type 29 and here the hex number is not a created date, it is unknown what this may be. Sometimes this number is negative for type 29, and a lot of volumes share the same number.

There is still some mystery about the hex number. For type=28, sometimes it is less than 8 digits long, and needs to be padded with zeroes at the end. This does produce an accurate date then. Also, sometimes it is longer than 8 digits! In these cases, truncating the number at 8 digits has again produced an accurate date in limited testing. It is unclear what those extra digits would denote.

Following this discovery, mac_apt has been updated to parse this date.

APFS timestamps

$
0
0
A small beginning to my reverse engineering efforts into APFS - Apple File System.

From APFS documentation it is revealed that the new timestamp has a nano second resolution. From my data I can see several timestamps in what appears to be the root directory for a test APFS volume I created. Armed with this information, it was pretty easy to guess the epoch - it is the Unix epoch. 

ApfsTimeStamp = number of nano-seconds since 1-1-1970

If you like to use the 010 editor for analysis, put the following code in your Inspector.bt or InspectorDates.bt file:

//----------------------------------------------------------------
// ApfsTime
//  64-bit integer, number of nanoseconds since 01/01/1970 00:00:00

typedef uint64 ApfsTime <read=ApfsTimeRead, write=ApfsTimeWrite>;
FSeek( pos ); ApfsTime _aft <name="ApfsTimes">;
string ApfsTimeRead( ApfsTime t )
{   
    // Convert to FILETIME
    return FileTimeToString( t/100L + 116444736000000000L );
}
int ApfsTimeWrite( ApfsTime &t, string value )
{
    // Convert from FILETIME
    FILETIME ft;
    int result = StringToFileTime( value, ft );
    t = (((uint64)ft - 116444736000000000L)*100L);
    return result;
}

Now 010 can interpret APFS timestamps :)

010 interprets ApfsTimes

If you need to read this timestamp in python (and convert to python datetime), the following function will do this:


import datetime


def ConvertApfsTime(ts):
    try:
        return datetime.datetime(1970,1,1) + datetime.timedelta(microseconds=ts / 1000. )
    except:
        pass
  return None


mac_apt + APFS support

$
0
0
Over the past few months, I've been working at adding APFS support into mac_apt, and its finally here. Version 0.2 of mac_apt is now available with APFS support. It also adds a new plugin to process print jobs, some enhanced functionality in other plugins and several minor bug fixes.

As of now basic APFS support is complete, mac_apt can view and extract any file on the file system, including compressed files. It does not have support for FileVault2 (encryption) and will not handle an encrypted volume. The checkpoint feature in APFS is currently not supported or tested although this may be added later.

This is the first forensic processing tool (in freeware) to support APFS. I believe at this time, Sumuri Recon is the only commercial one. I am unaware of any other that can read APFS.

I would like to thank Kurt-Helge Hansen for publishing the paper detailing APFS internal structure and working. He was also helpful in providing a proof of concept code for the same.

The implementation we've used is based on the APFS template built with kaitai-struct. Kaitai-Struct is a library that makes it easy to define and read C structures. It will generate all the code required to read those structures. For APFS, the kaitai-struct template was developed originally by Jonas Plum (@cugu_pio) & Thomas Tempelmann (@tempelorg) here.

APFS working and implementation

The approach we've taken is to read all inodes and populate a database with this data. This means we have to read the entire filesystem data upfront before we have information to read a single file. It isn't ideal, it practically takes 2-4 min. time to do this on an image having default macOS installation (using my slow regular SATA III external disk over USB3), which is not too bad. But I opted for this path as it is the only solution available for now. Why? The way APFS stores files in its b-tree, they are not sorted by name alphabetically. Instead, a 3 byte hash is computed for each file name and the b-tree maintains nodes sorted by this hash instead. The problem is that this hash algorithm is currently unknown. It may just be some sort of CRC variant or something very different. Until this algorithm is known, we cannot write a native parser that walks the b-tree. Hence the database for now.

The database does offer us several advantages though. For compressed file information, we can pre-process the logical size and save that for quick retrieval. In APFS, a compressed file will have its logical size set to zero in file metadata. To lookup its real size, you have to go read its compressed data header (which may be inline or in a resource fork), parse it and get the uncompressed (logical) size. This often means going out to an extent to read it, which makes it slow. Pre-populating this info in a database makes it much quicker for later analysis.

APFS allows extended attributes to be defined and used just the same as HFS+. This means a file can have extended attributes and those are used to save compression parameters (similar to HFS+). APFS also uses Copy-On-Write, which means if you copy a file, the resulting copy will not duplicate the data on disk. Both inodes (original and copy) will point to the same original extents. Only when the copy is changed will new extents be allocated.

If you are not familiar with APFS, the Disk Info output from mac_apt might look strange to you.

Screenshot - Disk Info data from mac_apt showing same offset & size for all APFS volumes
This may be read as 4 partitions all type APFS having the same exact starting offset and size! The reason for this is that APFS is a little different. It isn't just defining a volume, rather it implements a container which can host several volumes in it! This output is from a default installation of HighSierra, where the Disk partitioning scheme is GPT and it defines 2 partitions as seen in the screenshot below.
Illustration showing APFS container and volumes within the Disk

The APFS container by default does not put a limit on the size or location of those volumes within it (Preboot, Macintosh HD, VM, Recovery). Unlike normal partitions on disk where sectors are allocated for each volume before you can use the volumes, APFS allows all volumes to share a common pool of extents (clusters) and they all report having total free space as the same. But really its shared space, so you cannot sum it up for all volumes. This also means data from all volumes is interspersed and volumes are not contiguous. The design makes sense as the target media is flash memory (SSD), and it will never be contiguous there (as it did on spinning HDDs) because of the way flash memory chips work.

Reading Notes database on macOS

$
0
0
The notes app comes built-in with every OSX/macOS release since OSX 10.8 (Mountain Lion). It is great for quick notes and keeps notes synced in the cloud. It can have potentially useful tidbits of user information in an investigation.

Artifact breakdown  & Forensics

Locations 

Depending on version of macOS, this can vary. Sometimes there is more than one database, probably as a result of an upgrade! But only one is actively used at any given time (not both). So far, we haven't seen any duplicate data when two are present.

Location 1

/Users/<USER>/Library/Containers/com.apple.Notes/Data/Library/Notes/
In here, databases will be named as one of the following:
NotesV2.storedata ← Mavericks
NotesV4.storedata ← Yosemite
NotesV6.storedata ← Elcapitan
NotesV7.storedata ← HighSierra
If a note has an attachment, then the attachment is usually stored at the following location:
/Users/<USER>/Library/Containers/com.apple.Notes/Data/Library/CoreData/Attachments/UUID/

There does not appear to be much difference between the database types. The following tables have been seen.
     
Tables for NotesV2
Tables for NotesV6

Each note can be associated with either a local account or an online one. The following account information can be obtained.  

Account email address, id and username from ZACCOUNT table

Individual note data is stored in ZNOTEBODY and the rest of the tables provide information about note parent folder, sync information, and attachment locations. 

Notes converts all data to HTML as seen below.

ZNOTES Table with note Html content
The graphic below shows how you can find and resolve note attachments to their locations on disk. If an attachment is present, ZNOTEBODY.ZHTMLSTRING will contain the UUID of that which can be matched up to the ZATTACHMENT.ZCONTENTID to get a binary plist blob. When parsed, you can find the full path to the attachment in the plist.

Resolving attachment location

The dates and times fetched are Mac Absolute time, which is the number of seconds since 1/1/2001.

Reading the data

The following SQL query will pull out most pertinent information from this database:

SELECT n.Z_PK as note_id, datetime(n.ZDATECREATED + 978307200, 'unixepoch') as created, datetime(n.ZDATEEDITED + 978307200, 'unixepoch') as edited, n.ZTITLE, (SELECT ZNAME from ZFOLDER where n.ZFOLDER=ZFOLDER.Z_PK) as Folder,(SELECT zf2.ZACCOUNT from ZFOLDER as zf1  LEFT JOIN ZFOLDER as zf2 on (zf1.ZPARENT=zf2.Z_PK) where n.ZFOLDER=zf1.Z_PK) as folder_parent,ac.ZEMAILADDRESS as email, ac.ZACCOUNTDESCRIPTION, b.ZHTMLSTRING, att.ZCONTENTID, att.ZFILEURLFROM ZNOTE as nLEFT JOIN ZNOTEBODY as b ON b.ZNOTE = n.Z_PKLEFT JOIN ZATTACHMENT as att ON att.ZNOTE = n.Z_PKLEFT JOIN ZACCOUNT as ac ON ac.Z_PK = folder_parent

Location 2

/Users/<USER>/Library/Group Containers/group.com.apple.notes/NoteStore.sqlite
This one has been seen on El Capitan, Sierra and HighSierra. Attachments are stored in the Media folder located here:
/Users/<USER>/Library/Group Containers/group.com.apple.notes/Media/<UUID>/
Here UUID is the unique identifier for each attachment. The database scheme is different here.

NoteStore.sqlite in HighSierra

NotesStore.sqlite in ElCapitan


Only account name and identifier (UUID) is available. To get full account information, this will need to be correlated with the account info database stored elsewhere.
ZICLOUDSYNCINGOBJECT account info
Note data is available in the ZICNOTEDATA table. 

ZICNOTEDATA table
That ZICNOTEDATA.ZDATA blob is gzip compressed. Upon decompression, it reveals the note data stored in a proprietary unknown binary format. As seen below, you can spot the text, its formatting information and attachment info.

ZDATA gzipped blob showing gzip signature (1F8B08)
Uncompressed ZDATA blob showing text, formatting and attachment info

Most notable in this database is the presence of several timestamps-
Note Title Modified → ZDATEFORLASTTITLEMODIFICATION
Note Created → ZCREATIONDATE
Note Modified → ZMODIFICATIONDATE1
Attachment Modified → ZMODIFICATIONDATE
Attachment Preview Updated → ZPREVIEWUPDATEDATE

Reading NoteStore.sqlite


The following SQL query will pull out most pertinent information from this database:
SELECT n.Z_12FOLDERS as folder_id , n.Z_9NOTES as note_id, d.ZDATA as data,
c2.ZTITLE2 as folder,
datetime(c2.ZDATEFORLASTTITLEMODIFICATION + 978307200, 'unixepoch') as folder_title_modified,
datetime(c1.ZCREATIONDATE + 978307200, 'unixepoch') as created,
datetime(c1.ZMODIFICATIONDATE1 + 978307200, 'unixepoch')  as modified,
c1.ZSNIPPET as snippet, c1.ZTITLE1 as title, c1.ZACCOUNT2 as acc_id,
c5.ZACCOUNTTYPE as acc_type, c5.ZIDENTIFIER as acc_identifier, c5.ZNAME as acc_name,
c3.ZMEDIA as media_id, c3.ZFILESIZE as att_filesize,
datetime(c3.ZMODIFICATIONDATE + 978307200, 'unixepoch') as att_modified,
datetime(c3.ZPREVIEWUPDATEDATE + 978307200, 'unixepoch') as att_previewed,
c3.ZTITLE as att_title, c3.ZTYPEUTI, c3.ZIDENTIFIER as att_uuid,
c4.ZFILENAME, c4.ZIDENTIFIER as media_uuid
FROM Z_12NOTES as n
LEFT JOIN ZICNOTEDATA as d ON d.ZNOTE = n.Z_9NOTES
LEFT JOIN ZICCLOUDSYNCINGOBJECT as c1 ON c1.Z_PK = n.Z_9NOTES
LEFT JOIN ZICCLOUDSYNCINGOBJECT as c2 ON c2.Z_PK = n.Z_12FOLDERS
LEFT JOIN ZICCLOUDSYNCINGOBJECT as c3 ON c3.ZNOTE = n.Z_9NOTES
LEFT JOIN ZICCLOUDSYNCINGOBJECT as c4 ON c3.ZMEDIA = c4.Z_PK
LEFT JOIN ZICCLOUDSYNCINGOBJECT as c5 ON c5.Z_PK = c1.ZACCOUNT2
ORDER BY note_id
 
On HighSierra, use this query:
SELECT n.Z_PK, n.ZNOTE as note_id, n.ZDATA as data,c3.ZFILESIZE,c4.ZFILENAME, c4.ZIDENTIFIER as att_uuid,c1.ZTITLE1 as title, c1.ZSNIPPET as snippet, c1.ZIDENTIFIER as noteID,datetime(c1.ZCREATIONDATE1, 'unixepoch') as created, datetime(c1.ZLASTVIEWEDMODIFICATIONDATE, 'unixepoch'), datetime(c1.ZMODIFICATIONDATE1, 'unixepoch') as modified,c2.ZACCOUNT3, c2.ZTITLE2 as folderName, c2.ZIDENTIFIER as folderID,c5.ZNAME as acc_name, c5.ZIDENTIFIER as acc_identifier, c5.ZACCOUNTTYPEFROM ZICNOTEDATA as nLEFT JOIN ZICCLOUDSYNCINGOBJECT as c1 ON c1.ZNOTEDATA = n.Z_PKLEFT JOIN ZICCLOUDSYNCINGOBJECT as c2 ON c2.Z_PK = c1.ZFOLDERLEFT JOIN ZICCLOUDSYNCINGOBJECT as c3 ON c3.ZNOTE= n.ZNOTELEFT JOIN ZICCLOUDSYNCINGOBJECT as c4 ON c4.ZATTACHMENT1= c3.Z_PKLEFT JOIN ZICCLOUDSYNCINGOBJECT as c5 ON c5.Z_PK = c1.ZACCOUNT2ORDER BY note_id
If you are looking for an automated way to read this, use mac_apt, the NOTES plugin will parse it.

Bash sessions in macOS (and why you need to understand its working)

$
0
0
While all versions of macOS have provided bash_history for users, since macOS 10.11 (El Capitan), we get even more information on terminal history through the bash sessions files. This is not a replacement for the old .bash_history file which is still there.

There are several problems with bash_history - you cannot tell when any command in that file was run, the sequence of commands may not be right, and so on. For more on that, refer Hal Pomeranz's excellent talk - You don't know jack about Bash history

Even if there were no anomalies and only a single terminal was always in use, there is still the issue of how do I know which command was run when? With Bash sessions, macOS gives us more data to work with. Since El Capitan, every new terminal window will be tracked independently with a TERM_SESSION_ID which appears to be a randomly generated UUID.

Figure 1 - Fetching terminal's session id

Each session can also be restored when you shutdown and restart your machine with the "Reopen windows when logging back in" option set. Perhaps for this purpose, session history (a subset of bash history) is tracked and saved separately on a per session basis.

Figure 2 - Restored session

Show me the artifacts!

The location you want to go to is  /Users/<USER>/.bash_sessions

You will find 3 files for each session as seen in screenshot below.

Figure 3 - .bash_sessions folder contents


TERM_SESSION_ID.history    --> Contains session history
TERM_SESSION_ID.historynew --> Mostly blank/empty
TERM_SESSION_ID.session    --> Contains the last session resume date and time

Figure 4 - Sample .session file

Figure 5 - Sample .history file showing commands typed at terminal 


How this helps?

Some (but not all) of the problems associated with reading .bash_history are now gone.
Theoretically, as bash history is now also stored on a per session basis, this should make it trivial to track commands run in different windows (sessions). If you were expecting history for a single session in its .history file, then you thought wrong. The .history file contains all previous history (from earlier sessions) and then appended at the very end, the history for this session.

So can we reliably break apart commands per session? Is the sequence of commands intact? Let's run a small experiment to find out.

We create two sessions (2 terminal windows) and run a few commands in each session. Commands are interspersed, so we run a command in Session-1, then another in Session-2 and then again something in Session-1. We will try to see if order is maintained.

Session-1 started 9:44
Session-2 started 9:51
Figure 6 - Commands run with their sequence

Session-1 closed 9:57
Session-2 closed 9:59

Session-1 is closed first, followed by Session-2.  Here is a snippet of relevant metadata from the resulting files:

Figure 7 - Relevant metadata from stat command

Fun Facts

The start and stop time for a session is available if you look at the crtime (File Created time) for the .history and .historynew files. These are in bold in the screenshot above.

Created Time of TERM_SESSION_ID.historynew = Session created time
Created Time of TERM_SESSION_ID.history        = Session end time


Isolating session data

By comparing the data in various .history files (from different sessions), you can find out exactly which commands belong to a particular session. See pic below, where lines 1-181 (not shown) are from older history (other past sessions). Lines 182-184 are from Session-1 and are seen in its history file at the end. Session-2 (closed after Session-1) has the same format, ie, old session history with this session's history appended (lines 185-189).


Figure 8- .history files from Session-1 (Left) and Session-2 (Right)

This is easily done in code and the mac_apt BASHSESSIONS plugin parses this information to break out the individual commands per session, along with session start and stop time.

While you still cannot get the exact time when an individual command was run, the sessions functionality does give you a very good narrowed time frame to work with. While we do not have the absolute order of commands ("cp -h" was run before "printenv"), we do have a narrowed time-frame for the set of commands ("cp-h" run between 9:51-9:59 and "printenv" run between 9:44-9:57). This is a big thing for analysts and investigators!


APFS template for 010 Editor

$
0
0
For quite some time, I've been analyzing APFS mostly with custom python code, which is not very efficient and rather time consuming and is not visual. Since most people doing any kind of serious hex editing use the 010 Editor (as do I), this was long overdue.

I've created an 010 template, which is basically a port from the apfs.ksy project. This has taken quite a bit of time and I hope you find it useful. Not all structures are known, there are some parts that may be incorrect. This is a work in progress as more details about APFS emerge..

Link: https://github.com/ydkhatri/APFS_010/blob/master/apfs.010.bt

The template will not parse out the file system tree yet. With APFS this is challenging to do within 010's template capabilities as you cannot create local objects or classes and/or store temporary objects. The template does however define most of the structures and will follow most pointers (to other disk blocks and parse them) automatically when you start expanding the structures in the template viewer.

To use the template, simply load your APFS image (unencrypted only) into 010. Then edit the template to set the Apfs_Offset variable to the byte offset of wherever your APFS partition starts. This can be located easily by running the GPT template (which you can find on 010's website or in the program's template repository). The GPT template will give you the sector offset, multiply it by sector size (usually 512 or sometimes 4096) to get the byte offset (location) of the APFS partition.

An open source spotlight parser

$
0
0
Spotlight is the name of the indexing system which comes built into macOS. It is responsible for continuous indexing of files and folders on all attached volumes. It keeps a copy of all metadata for almost every single file and folder on disk.

Thus, it can provide some excellent data for your investigation. While much of the same information can be obtained if you have access to the full disk image, it is known that there is information in this database that is not available elsewhere. Details like Date(s) Last Opened or Number of Times (an application or file) is Opened/Used are not available anywhere else on the file system. Unfortunately though it uses a proprietary undocumented format, and no publicly available code existed to read it. So over the last few months, I’ve been studying the file format of these databases and have created a tool/library to read and extract the data contained within.

The library and tool are open sourced now and located here:
https://github.com/ydkhatri/spotlight_parser

The format of the database will be discussed in a later post.

For those familiar with macOS, you know this data (contained in the database) can be obtained on a locally mounted volume using the macOS built-in mdls utility. However to do this, you need to mount your disk image on a mac to do so and the utility can only be run on individual files/folders, not the entire disk. It can be run recursively (with a bit of command line fu) on the entire volume but the output is not easy to read then.

If you don't prefer to do that, run spotlight_parser instead. Just point it to the database files which are named store and .store (located in the /.Spotlight-V100/Store-V2/<UUID> folder) and let it parse out the complete database for you.

Here is a screenshot of spotlight_parser running. Depending on how much data is contained in the database, this can take anywhere between a few seconds to a few minutes (5-10 on very large disks with lots of files).

Figure 1 - Running spotlight_parser

Once done, you will have 2 files as output. One is a text file (prefix_data.txt) containing the database dump of all entries. The other is a CSV (actually tab separated) which tries to build a path for every file/folder using inode number (CNID) from data available in the database. Since not every single folder may be included, some paths may not resolve and you might get ..NOT FOUND.. in the path sometimes along with an error on the console as seen above.

In the prefix_data.txt file, you will see some XML content (configuration information) at the beginning followed by database entries for files and folders.
Below is a snippet of the prefix_data.txt file, showing only output for a single jpg image file.

Figure 2 - Output showing a single jpg file's metadata information from database

Here the text in Red is metadata pertaining to a single entry in the database, including the date and time it was last updated. This is followed by the metadata itself. The items in Blue are information only available in the spotlight database. The last two may be of particular interest to an investigator.

Note - The screenshot above is not from any special version of the code, actual output is plain text, it has no coloring! Colors were added just for explanation.

The spotlight_parser has been incorporated into mac_apt as the SPOTLIGHT plugin. In mac_apt, the output is also available in an sqlite database making it easier to query. Mark McKinnon has forked a version of this library and also added sqlite capability, it is available here.

While this exposes the data and makes it available, it is still not easy to query. Perhaps one of these days, I will write a GUI application with drop-down boxes for easily accessing and querying the output data.

Viewing all 61 articles
Browse latest View live